

 Pearl Burgoff
1 min read
Qnect Hosts Special Analytics Webinar | Qnect
Why do fabricators care about analytics now? What has created this demand to have access to early data only available with advanced software?

Qnect's Analytics webinar, that took place live on January 22, recieved strong engagment from the audience and generated some insightful questions that we include in the video as well as at the end of the transcript.
View this special "How-To Webinar" and learn how to gather early data for smart decision making for great job performance. We know that early data matters. You know that early data matters.
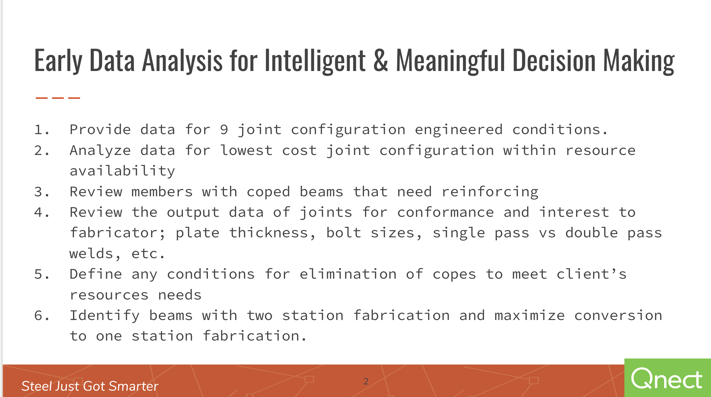
In this special webinar, you will learn how to:
Join Qnect’s Co-Founder Henry Lederman, a 47 year veteran of the industry, and Qnect’s Account Manager, David Kowalski, to start using analytics on all of your projects in 2020.
The webinar transcript follows the video and starts at the 1:12 mark, after the introduction. Please enjoy and contact us with additional questions.
Welcome everyone. I'm very happy to be here with you today. Today, we're going to discuss analytics. Qnect is proud to offer important and significant early data and computational analysis support resulting in better decision making for your job and company success. What makes this possible is the fact that Qnect is extraordinarily fast and gives you a ton of data but with the time to think about it and to make good decisions.
Let's just go over some of the ways we do this and what we provide. First, we'll actually run the building nine different times trying different joint configurations - single angle, double angle, share plates, three quarter bolts up to inch and eight.
We will analyze the data for the lowest cost joint configuration within the resources that you say are available and within the requirements that you have.
You'll see the data. We will offer our thoughts in analysis. We will review the members that our cope that need to be reinforced by providing you a report that shows you the capacity of the beam. Prior to reinforcing allows you to talk to the engineer to either reduce the loads up size to beam.
You'll have the ability to review a specific output data for every joint and for the joints globally - plane thicknesses, both sides, single pass, weld etc. We will define any conditions for elimination of copes. For example, if your shop are coping manually this is very expensive and we could look at ways to eliminate copes and certainly from an analytic standpoint to identify the number of cases that are possible for conversion.
We can identify beams for two station fabrication and maximize the conversion to one station fabrication.
So there's a lot here and again it can happen in the estimating stage or production.
Let me sort of start at the end. Just to bring you visually right into what analytics could entail and it's more than what you're about to see. So this is a - one specific joint - that we're looking at on a job that is still in the estimating bidding stage. This first picture here represents the design requirements. The beam is filled up three quarter inch bolts and the connection requirement is 66 KIPS but as you can see here the capacity is 159. It's extraordinarily high in terms of what is needed. Sometimes you can bring this kind of reduction as a VE credit to the bidding process.
We can see we need 18 bolts and the engineer wants to angle conditions. Once we remove this “fill a beam up” criteria we now see that we can reduce to bolts 50%. We still have extraordinary amount of capacity of 90 KIPS to build three quarter bolts and two angles. So a huge huge improvement. But then we can look and say, “alright, well can we use a single angle?” This would be a case where your shop would like to see bolting more than welding. Sure enough our capacity is a little bit more than the reaction, just almost the same. We do have one more bolt in this condition eight bolts less than the first condition but now we have one angle instead of two. And easier to erect. Then we can go one step further during the analytic process and say, “alright, what happens when we use one inch bolts?” As you can see, a dramatic drop in bolts from the original 18 - only a third. So we've dropped about two-thirds we do need a half-inch angle and the capacity is certainly well within what we need.
Now we have data - interesting data - that allows us to say, “okay what what can we do here what is the best for us?” for you the fabricator. So I want to kind of paint this picture on a joint but really what we're doing in this analytic stage is running the whole building with these multiple, in fact, nine different options.
So let me now continue and go to the beginning and show you how this all works.
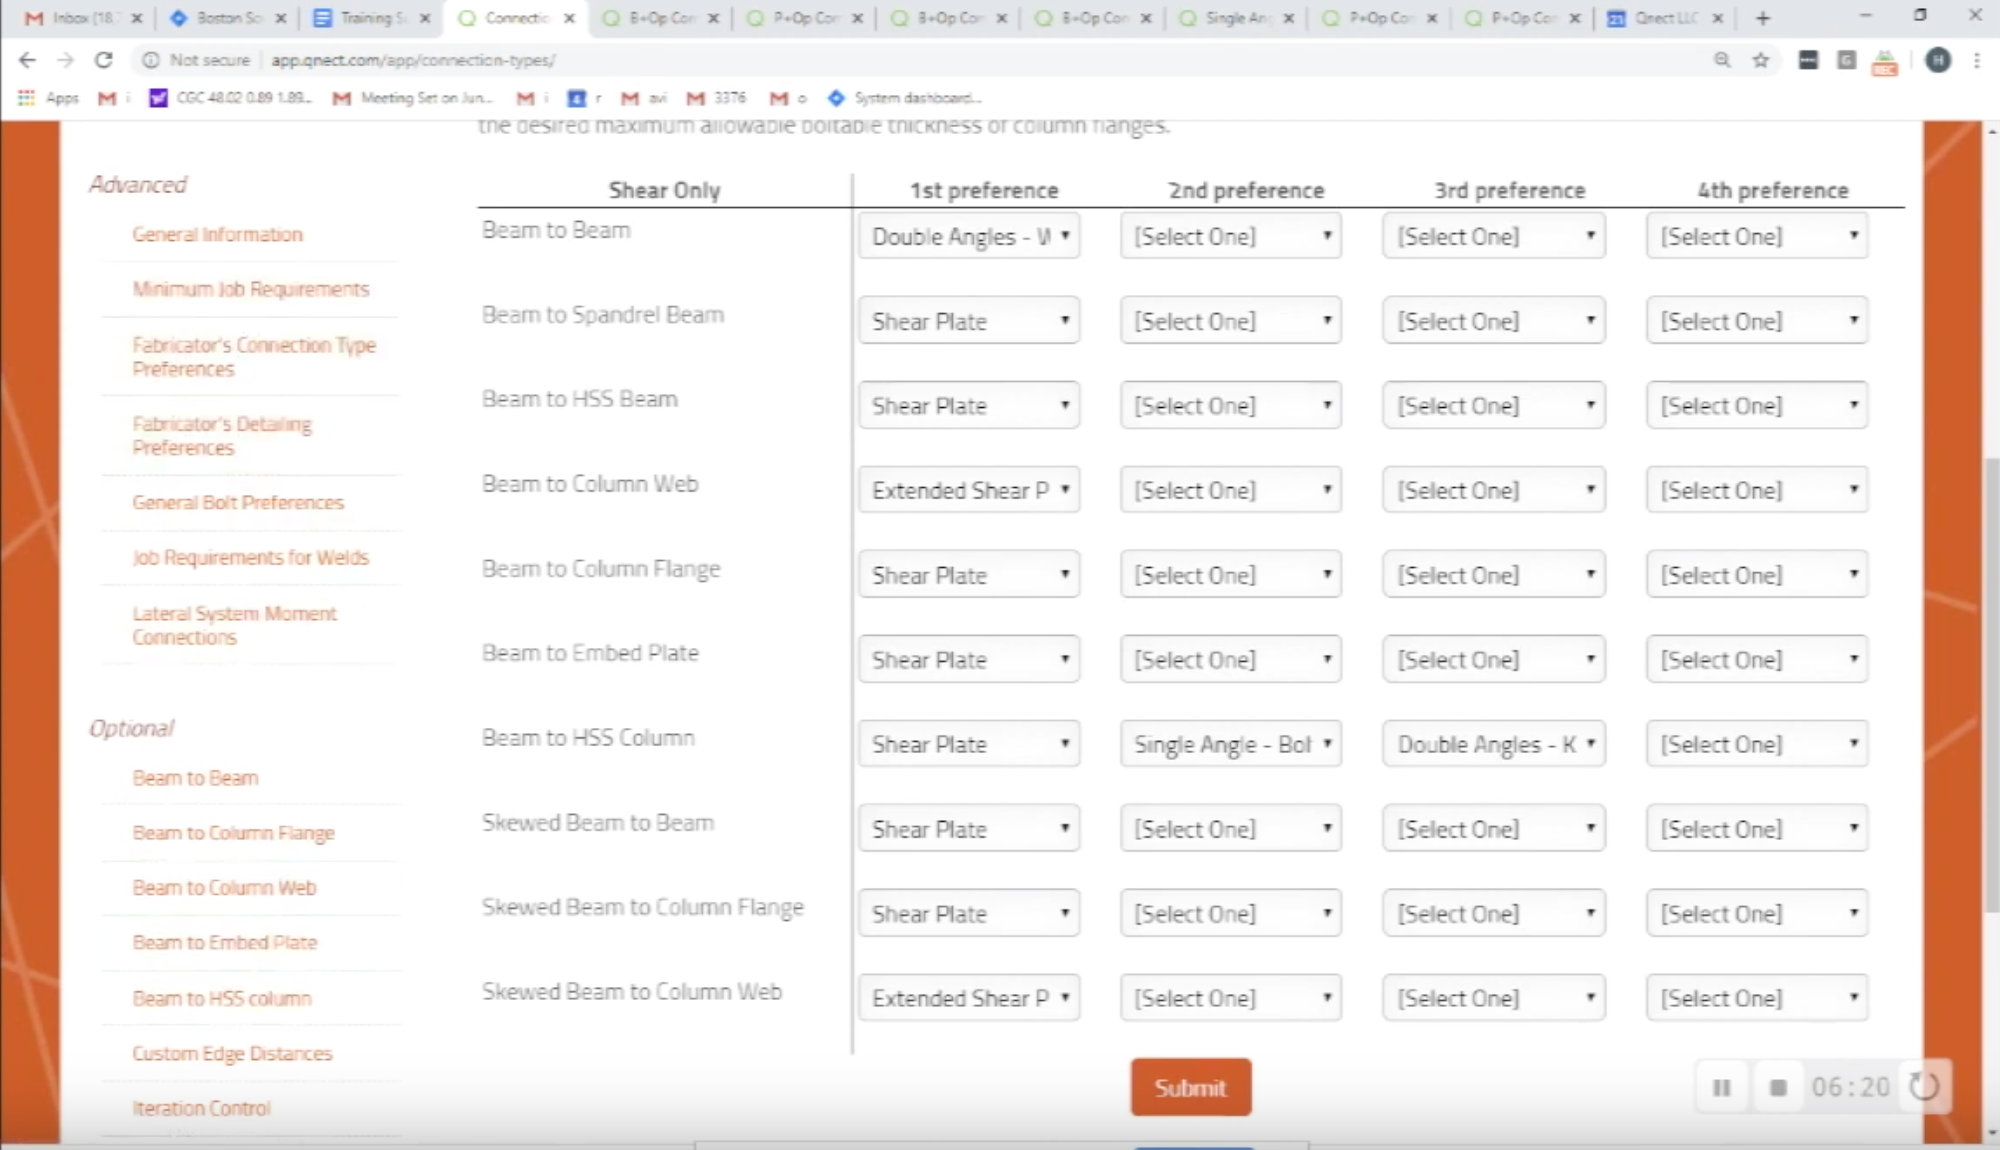
I'll start with a quick refresher. As you can see here, we're now on the Qnect website. We’re doing this job demo building. We've set up all the preferences that would determine the design requirement. Preference optimization and bolt optimization will be part of the analytics data that we will have to make these decisions. Just as another example of one of the preferences, you can see here is where we set up the local conditions - double angle welded bolted extended shear plate etc etc. We're setting it up for the fabricator and their needs. Then we're going to run accordingly.
Once this is all set up, it takes about 40 minutes, this information can be copied for the next job. Now we're ready because every connection will be done that way. Alright so we're now in the Tekla model as you can see it's a stick model. It's nothing here. When we go to Qnect you'll see our Qnect tabs and we select from the lower right upper left. We hit Button 1 and just going to show you how this works. We'll type in any session name and we would typically submit; we're not going to do that today. It'll pull the data off to the website, organize it, engineer it and then when it's ready we'll send you an e-mail and we're going to pull it back down from the web. Each joint has a custom design and custom component so it's extraordinarily efficient and fast. We do this whole joint and whole building in a minute and 20 seconds. We'll do any building. No matter what size, we’re able to run the whole analytics within 24 hours.
As you can see all the connections have been returned at least about 60 to 80 percent. We have moment connections. We have top and bottom moment plates with deck support. So this is the typical process Button 1, Button 2.
Now to continue the analytics story, I want to just show you one of the ways we optimize and that becomes part of the nine runs we do in addition to the nine runs we're simultaneously optimizing each joint.
So here we have a joint, it's six bolts. We're going to optimize that. We'll delete. We'll select one. We'll select Button 2. We will hit Button 1, again we won’t do the process because I've already done it. We'll look for the returned joint its “Analytics 2” and we submit.
As you can see with optimization, in this case it's a substantial reduction, very much like the case we saw also at the beginning of this webinar. With optimization we often see typically see one to one half bolts per ton and savings. In this particular case, we have one, two, three, four fewer bolts; six few bolts to purchase; we have two fewer bolts in the shop to install; four fewer bolts in the field; and twelve fewer holes to drill, cut or punch.
So that's sort of how the data collection happens:
So let me show you how that data might look. Here is a report of a job that has one, two, three excuse me four, five, six, seven, eight, nine jobs. We have the baseline which is what the client says they would like to use.
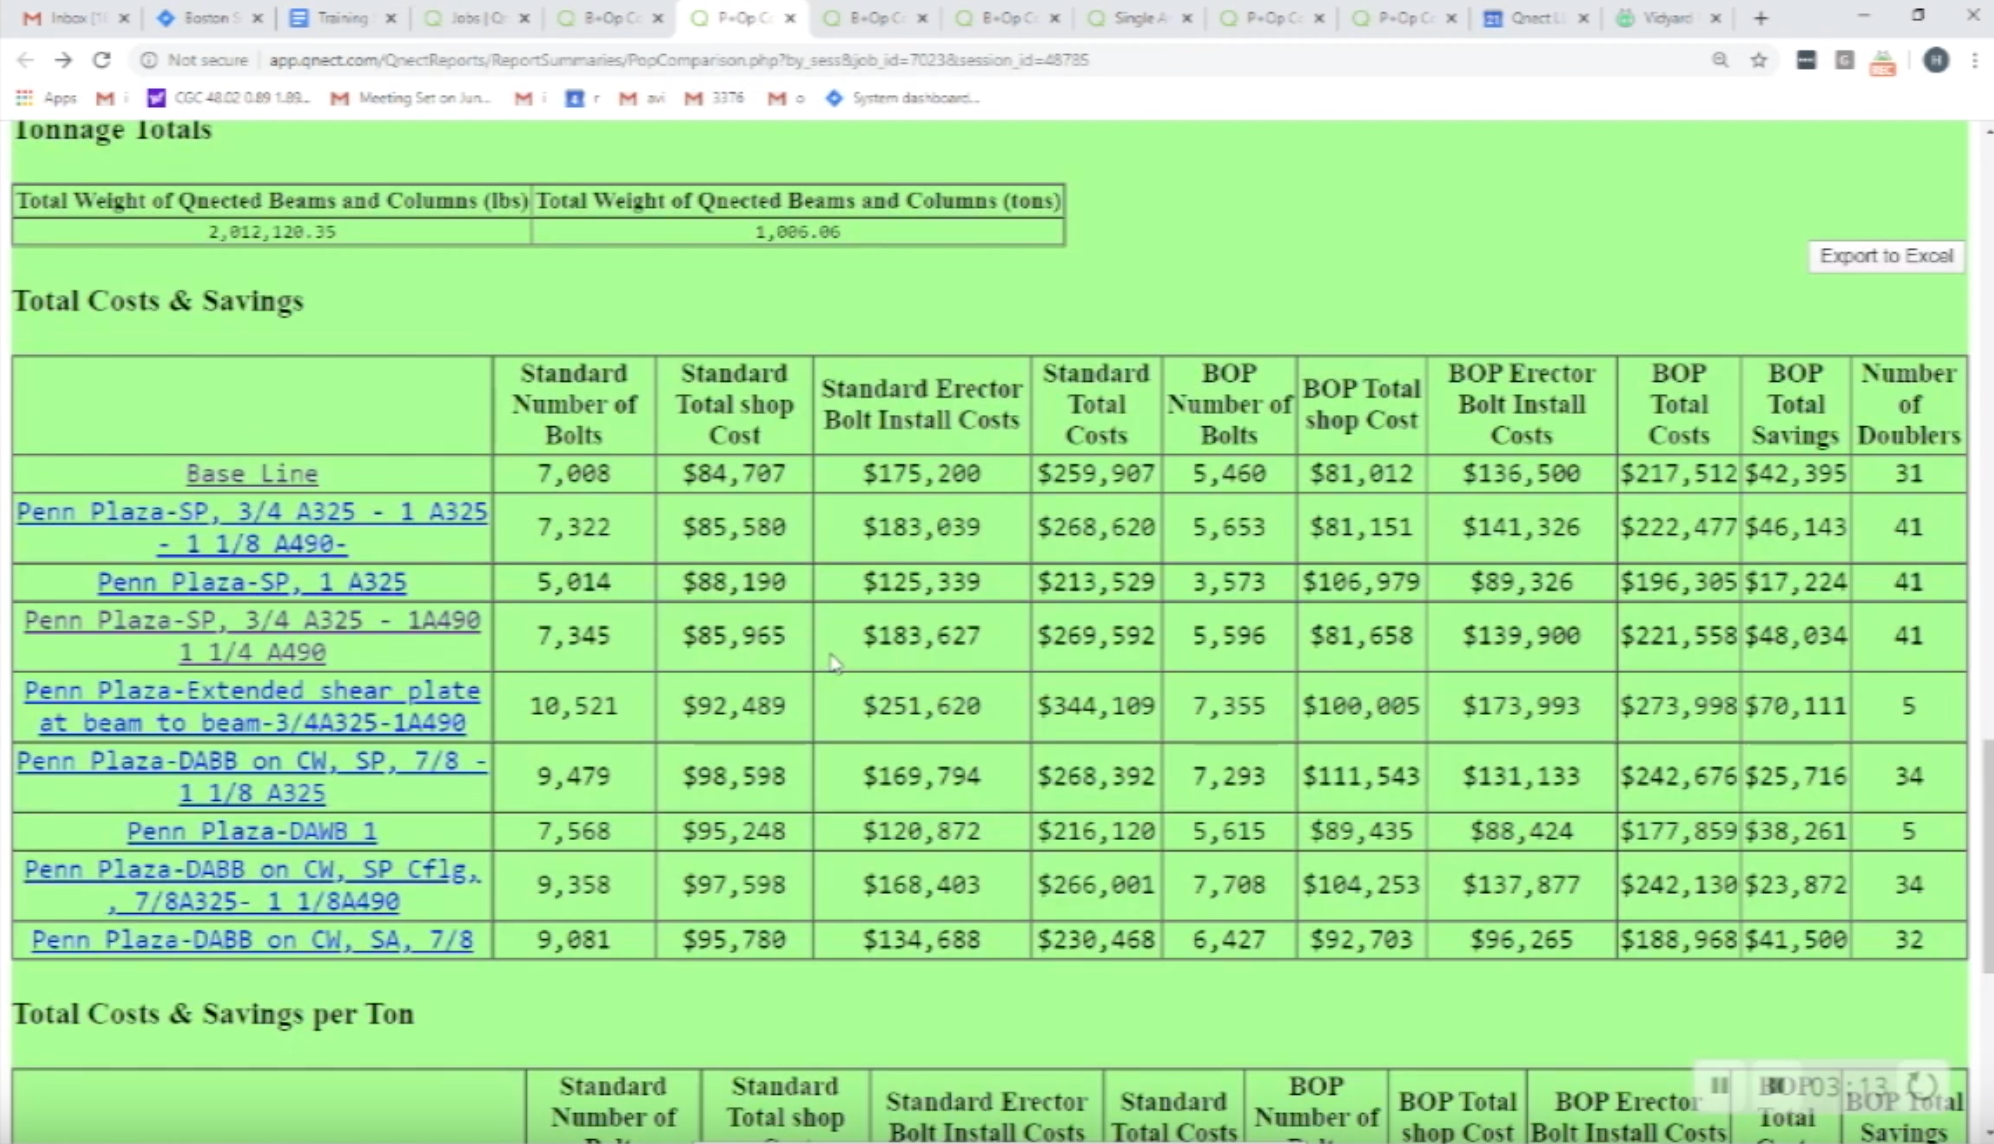
We have all kinds of different configurations. Now, we don't have to stop here, these are default settings we've come up with but we could try other things. In the group, from here to here, is the standard connection, which is three inch vertical spacing and it gives you the shop erection and total cost.
As you can see if you just wanted to compare blindly - meaning without restraint of resources - we can see that we have 7,000 bolts we can get down to 5,000; or $259,000 we can cut down to 230. So again a lot of data. We can then look at the optimized joint similar to the sketch the joint I just showed you and we can see if we stayed with the baseline 5,000 bolts vs. 7,000 and a savings of $42,000 but if we just went to the lowest cost, which looks like one 177 end of total cost we would compare that to a 259 substantial savings. Similarly 5600 bolts versus 7,000.
Again good data to understand what's going on
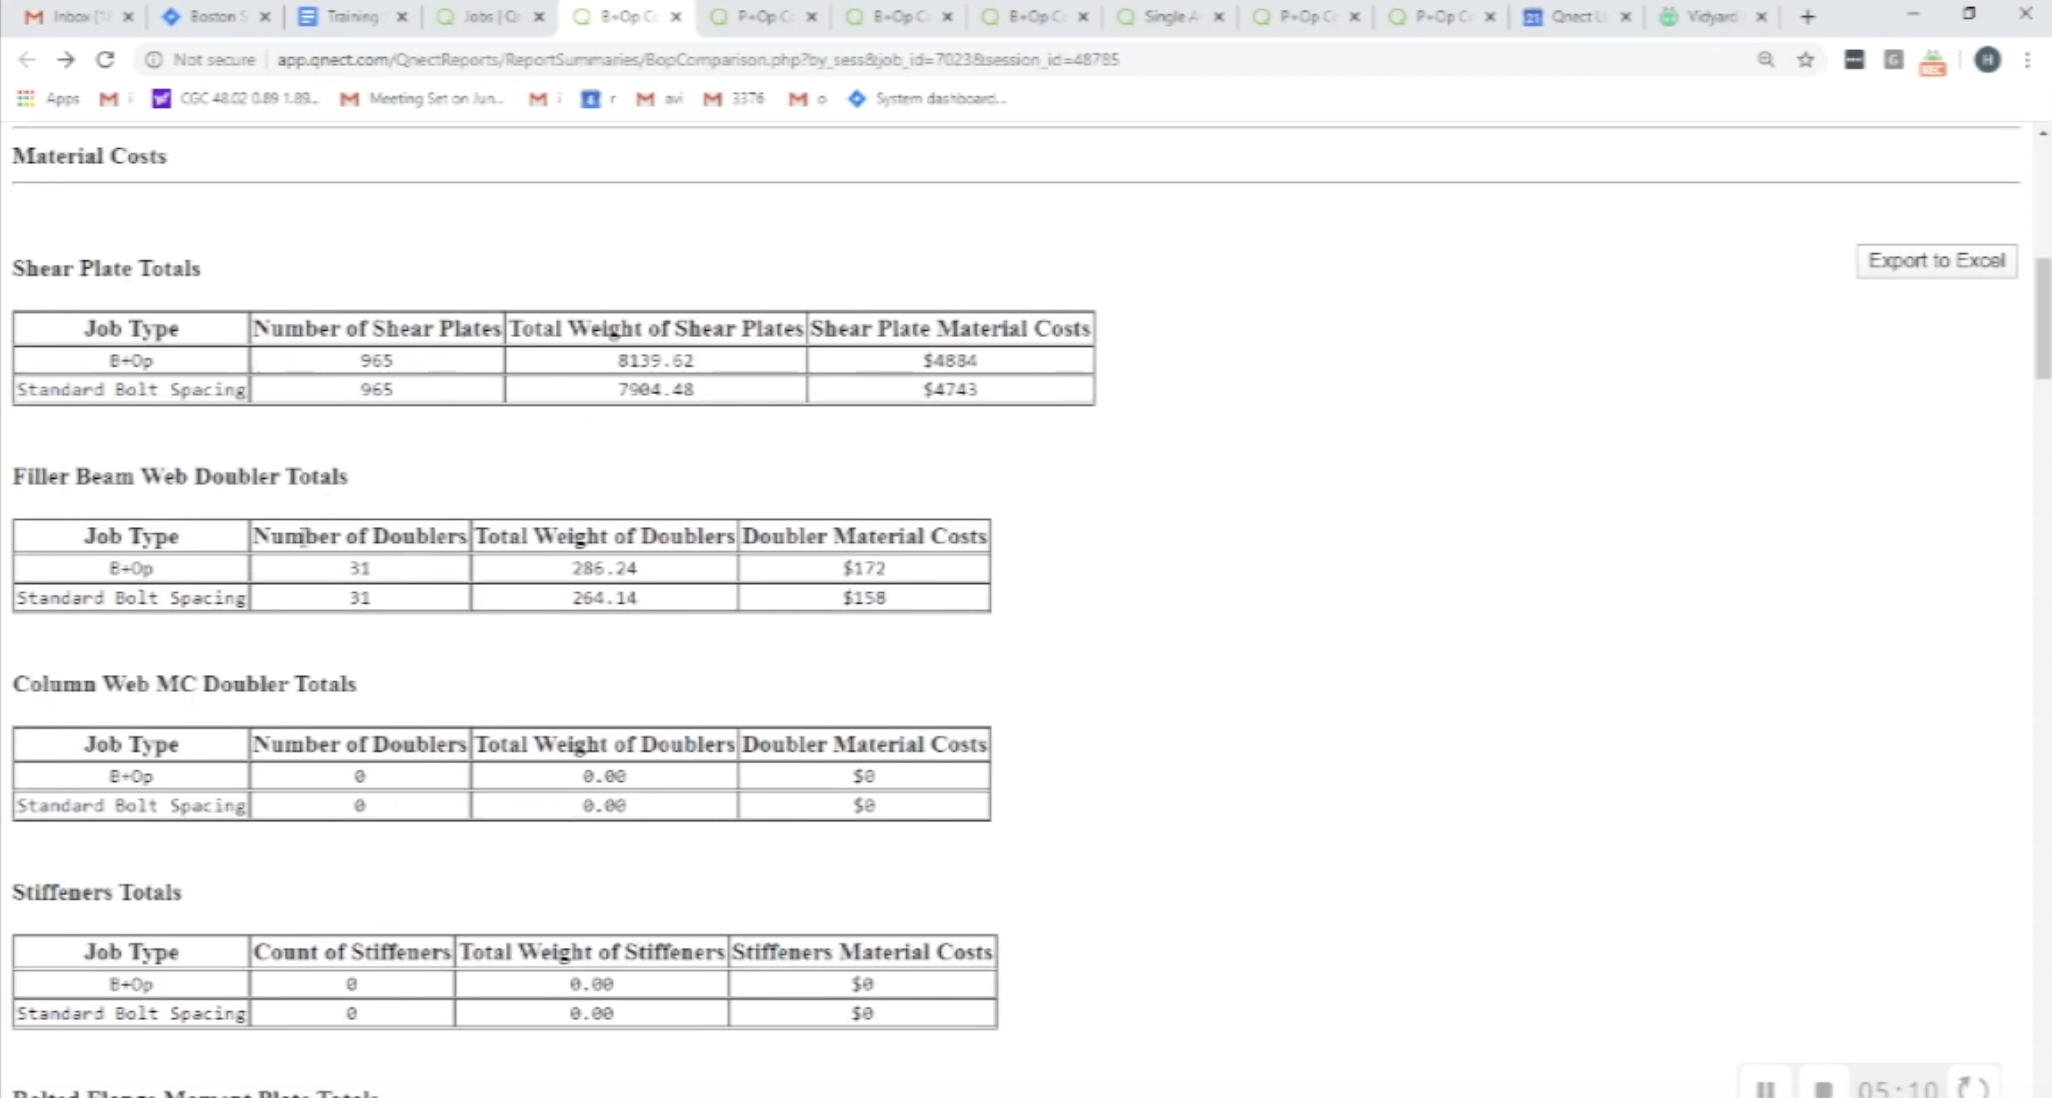
Let's dig a little bit deeper. Look at the one of the output data, number of plates. You'll see here we have doubler plates where the beams are coped and reinforced. To understand that we will go to the doubler report. Again analytics during estimating or production. We can see for example, small beam to a very large beam reactions thirty and disconnections only good for twenty five. Not a very heavy lift to imagine the EOR (Engineer of Record) will be able to reduce the load but in other cases maybe he up sizes the beam - 1626 40 KIPS to thirty three etc so that's another part of analytics and we continue down. We will see all of the welds that are currently in the job - exact fillet welds, CJP, PJP and exactly all the bolts. All of this information can be provided through a KISS file or an Excel export. And we've exported one of the jobs will show you what else we can do with that information.
Let's take a look at an exported file.
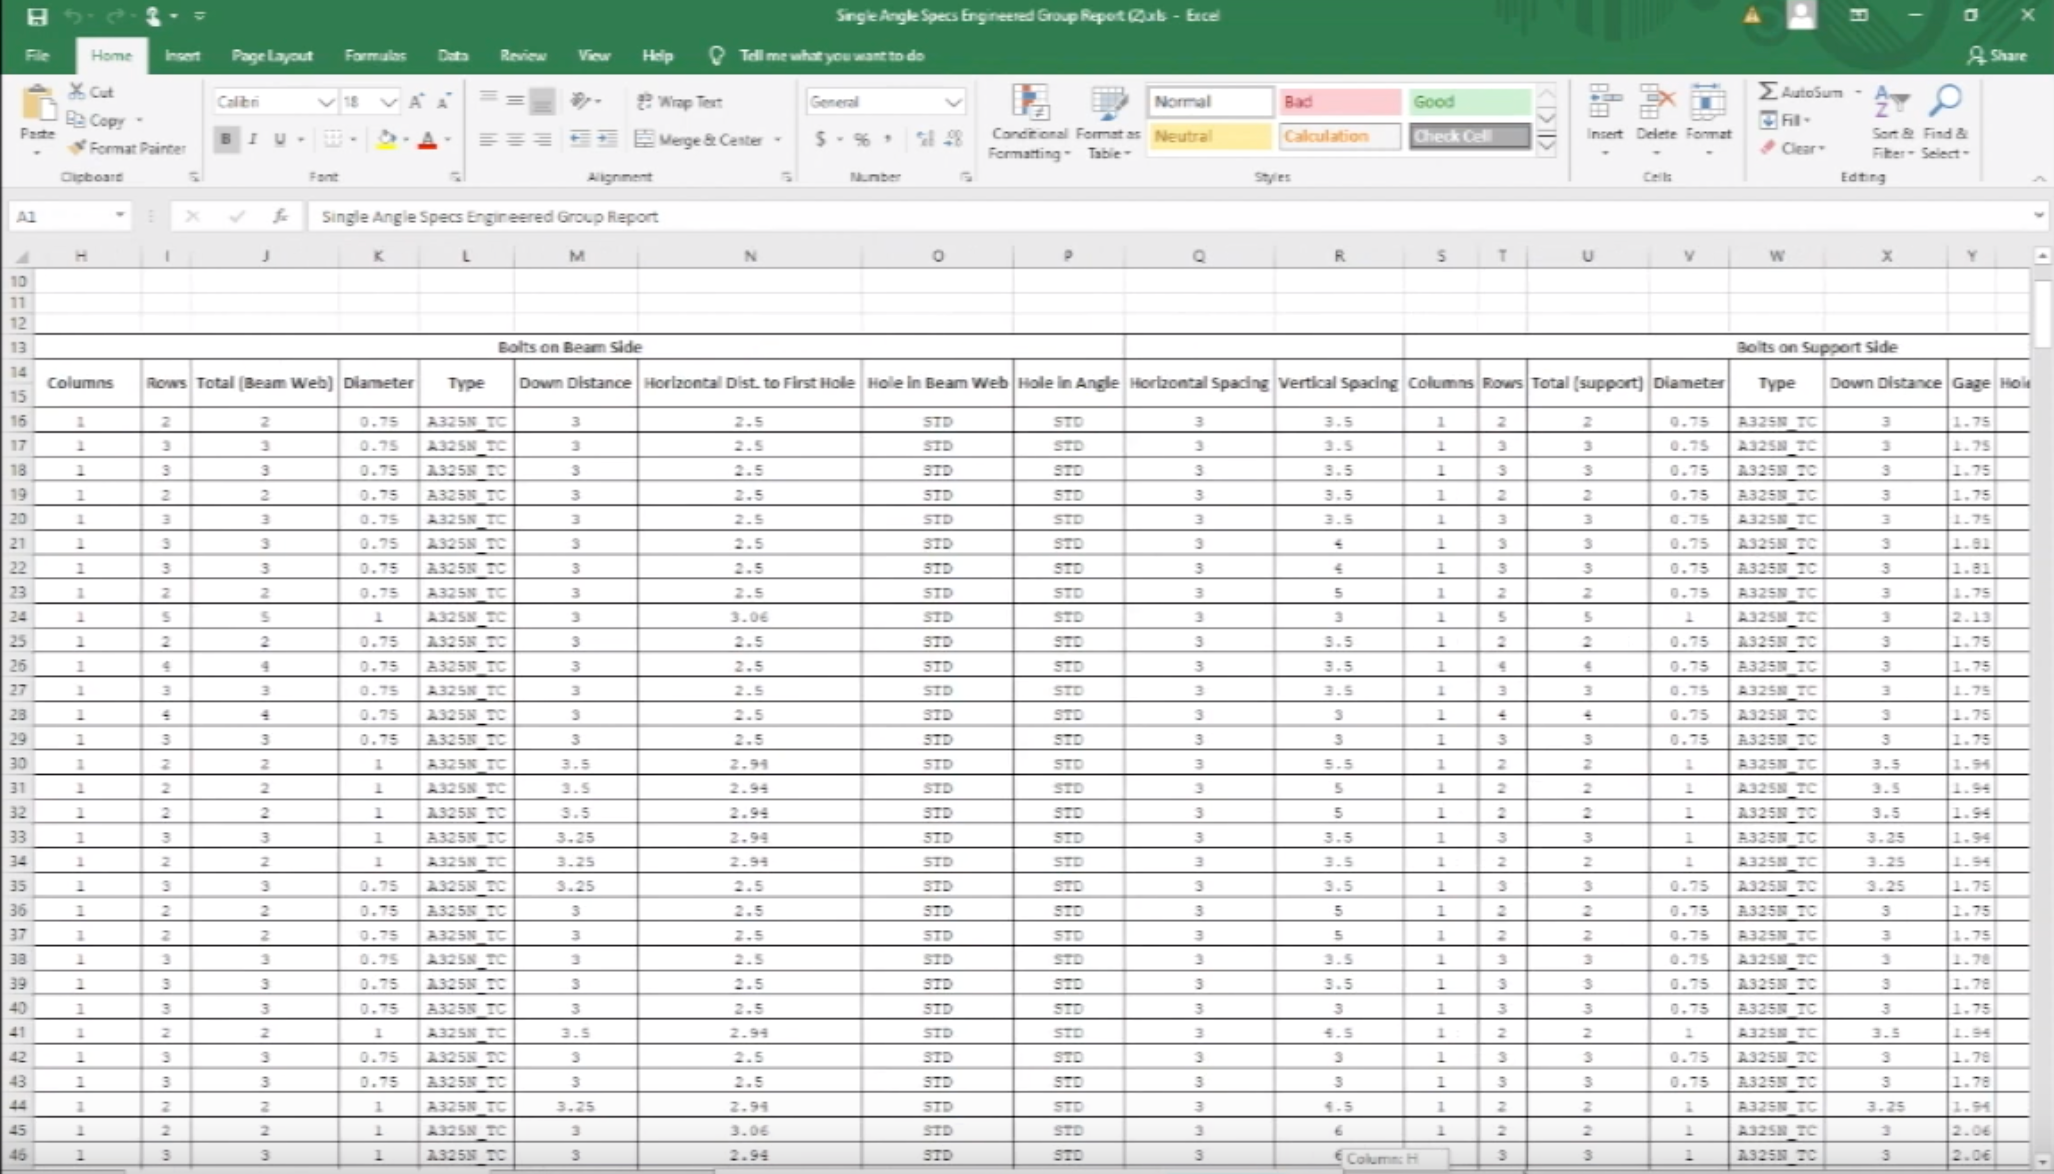
Here you can start by you know just understanding the nature of the connection. Are they always three-quarter inch bolts? No, we have some one inch bolts. What is the thickness off the, in this case, angle material? I see we have three eighths and we could sort this Excel file to see you know are we getting angles sizes that we want to work with because you can limit the sizes on the Qnect website for exact sizes that you want.
We are getting a window into the future of this job running through the shop. We're able to determine, to observe and to correct where we want to - angle sizes, plate thicknesses that we want to make sure makes sense for us and that works for us.
We'll also see vertical spacings that we're using three and a half or five we can limit the vertical spacing as well. We don't have to go three three-and-a-half four four and a half five we can go three four five but we can see the kind of quantities that are being produced.
Alright, so this is again all part of analytics. The last piece I want to just quickly show you is that we will color code the entire building once it's Qnected for the beams that are two station fabrication.
As you can see in this case, there are quite a few in this building. Through an iterative process, because we don't know for sure if the connection will be able to be changed so that is one station but we certainly could work to create that. Then we would come into the model and take the beam and let's say we would change the end connection to welded or bolted condition by simply correcting the the end condition locally. So in this in this place here we'll try different iterations.
Let's just come back to the overview of the analytics and again there's a lot to show. I've shown you a lot early dater is everything because you can then make the right decisions for your job each job being different, for your resources, even mixing up welding versus bolting depending on the backlogs you see. All of this will happen even during estimating but most important when you have some time to think. As you know jobs you pull you very quickly and there's no pressure, is intense and there's no time to review.
Again nine joint configuration, lowest cost review beams that need reinforcing review all the output data specifically as you saw in the Excel spreadsheet potentially eliminate copes and identify two station fabrication.
With that let me turn it over to David see what questions you folks me how so thank you very much.
Do your clients currently use it analytics in estimating?
Yes they they absolutely do in fact we have several clients that we have integrated fully with they're estimating process where we've done some custom programming to integrate fully and we go through the analytics much of which you saw today to support their winning of a bid.
Do EORs accept varying bolt spacing?
Ok so I guess that question applies to the varying of the vertical bolt spacing - that is the basis of our reduction of time to fabricate. In erect, primarily, the vertical spacing is 3 inches on most conventional systems everywhere and we vary that spacing from 3 to 6 inches in half-inch increments selecting the vertical spacing with a fewest number of bolts. I believe that's what the question is asking. First, I'll say that for some clients the iteration through those increments 100 percent is fine with them. For others, they like to use 3 inch 4 inch 5 inch or 3, 4 and a half and 6 so you have a lot of flexibility. EORs through all of the projects we've done have never complained about it. We provide complete and accurate limit state calculations that is completely pieced out by our connection engineer, a partner, and once they understand the integrity and the quality control they actually are pretty happy to use Qnect to do their approval process using the Qnect system. So we still you know you might might decide to ask for permission but typically if the engineer says you're to design the joint we proceed move forward and we don't have a problem with it.
Who manages one station fabrication and how?
The one station fabrication is managed by Qnect. You know in our workflow we will work with the detailer for the first several jobs to help the transition from the way they think about in process today to this change in methodology. So we'll take their model either a live model while it's not in use by them or through a model sharing and we'll take our software which will run through the building, color code the beams that are that have two station fabrication, as you saw in the video. We also can color code other things like all the beams that have no copes and just holes in case they want to selectively fabricate a group of beams that becomes a backlog. So we'll take the model, we'll run it we will identify the conditions and then we will through an iterative step check the engineering to see if the the change for the connection - that is a change within the parameters - that a fabricator has set will actually conform and result in a 1 station fabrication. Once that's done we'll identify that locally and now the detailer can take it back either with the connections or run it later themselves
all right thank you very much so I'd just like to thank everyone for attending this webinar today and also I wanted to let you know I have our contact information here you'll be able to find Christian Erickson's contact information as well as my own below feel free to reach out to us with any questions in regards to webinar or any questions about tunics
once again thank you all for attending
Access the Qnect app to enhance team collaboration and project efficiency. Sign in or create an account to manage communication and workflows with clarity and control.
.png)
1 min read
Why do fabricators care about analytics now? What has created this demand to have access to early data only available with advanced software?

1 min read
"LAST MONTH, I wrote about how early connected models can help steel fabricators. This month, let’s expand the discussion to include the myriad...

1 min read
As we enter the summer season, many of you are planning your school breaks and getaways. With it also being half way through the year, I wanted to...