
Analysis Summary
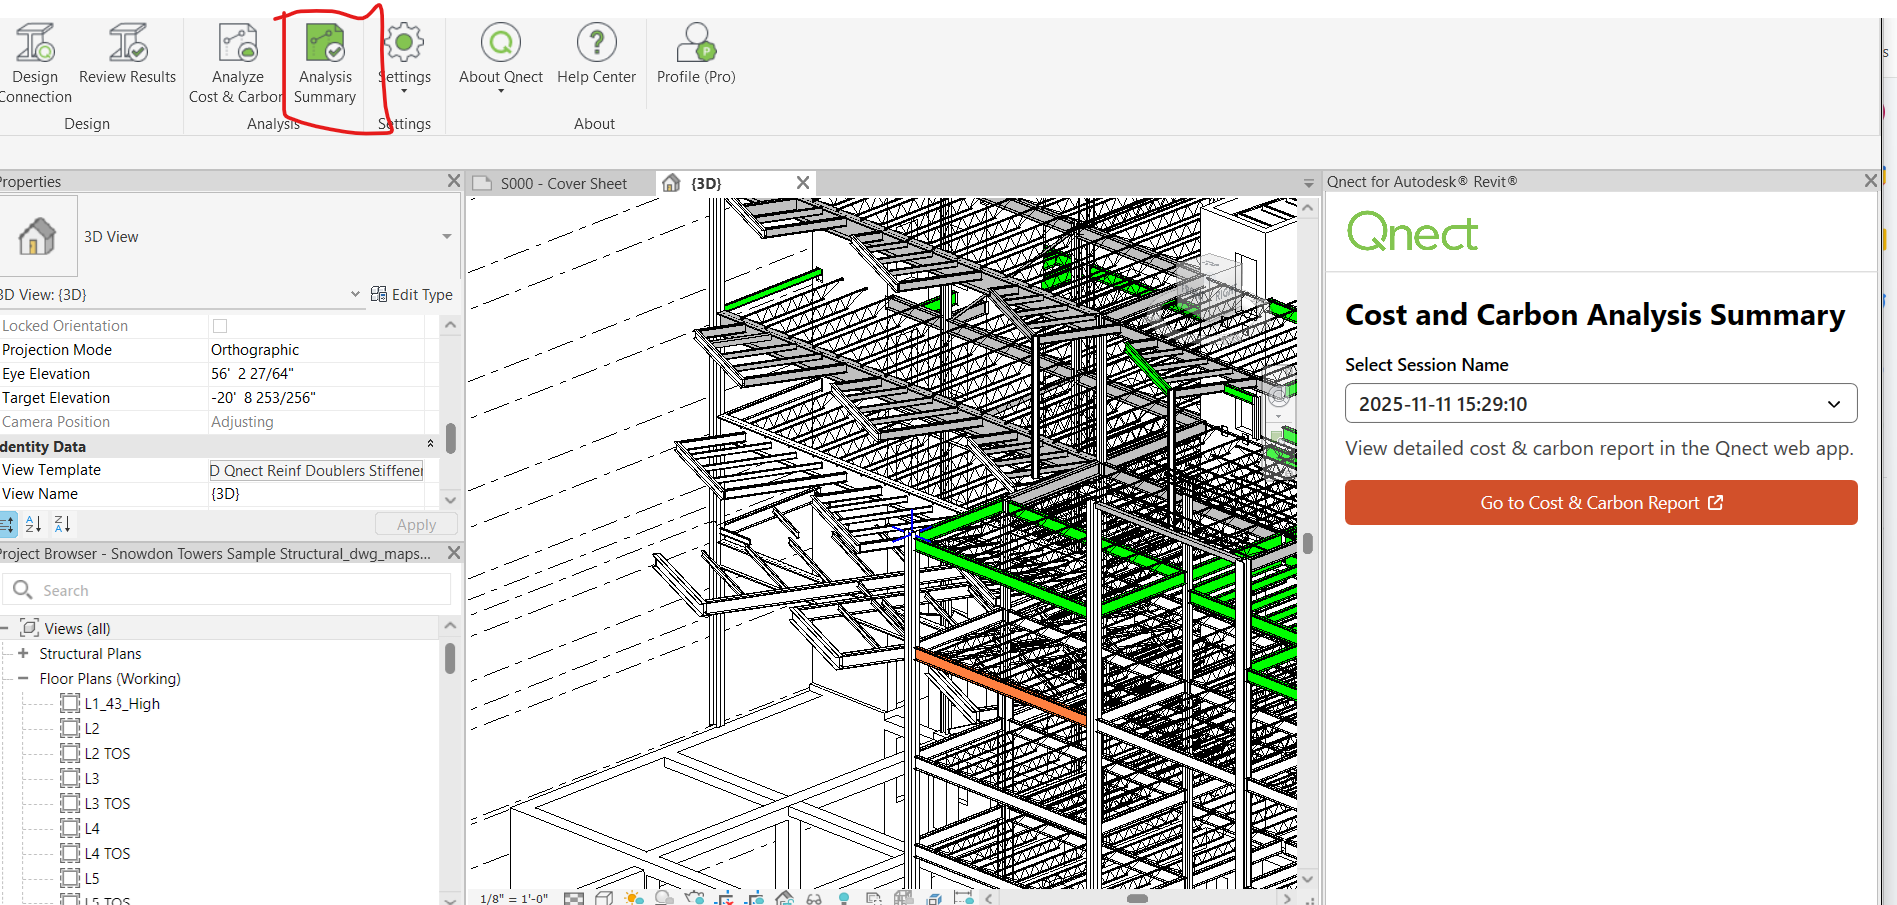
Dashboard Visualization
The following dashboard visualizations compare the cost and carbon data of 9 different connection strategies for the structure. Here is an example web dashboard report.
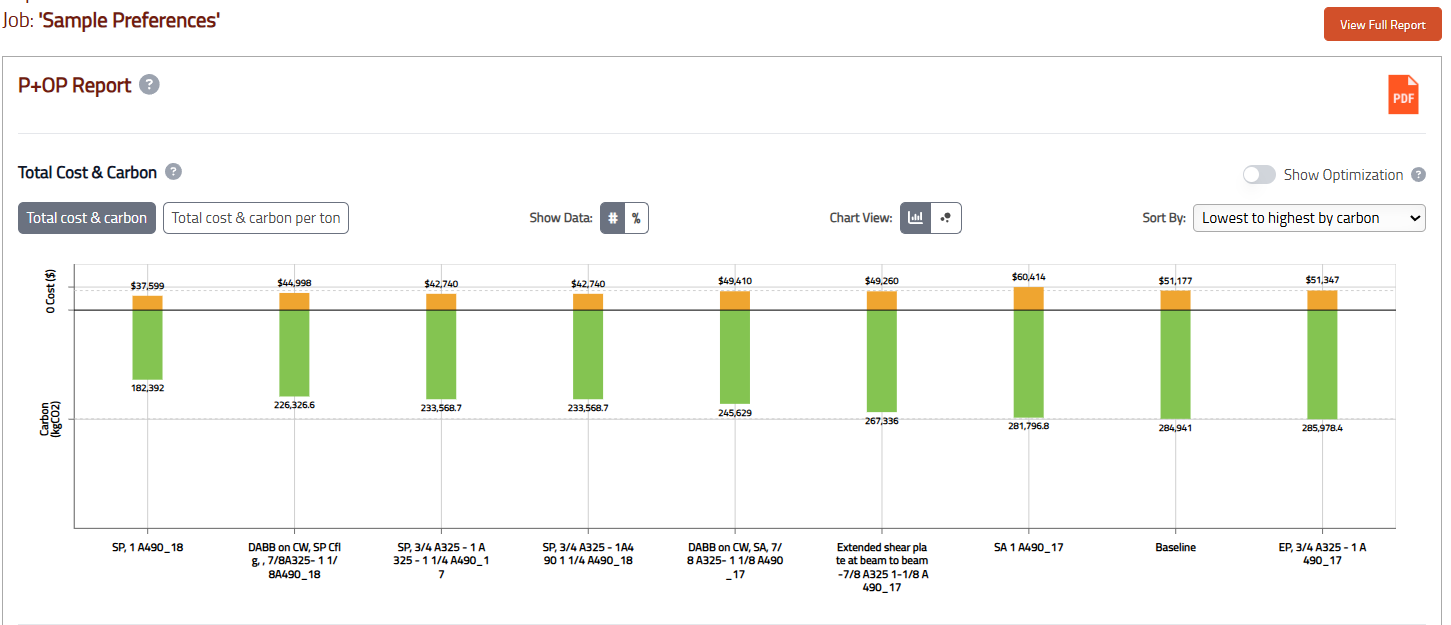
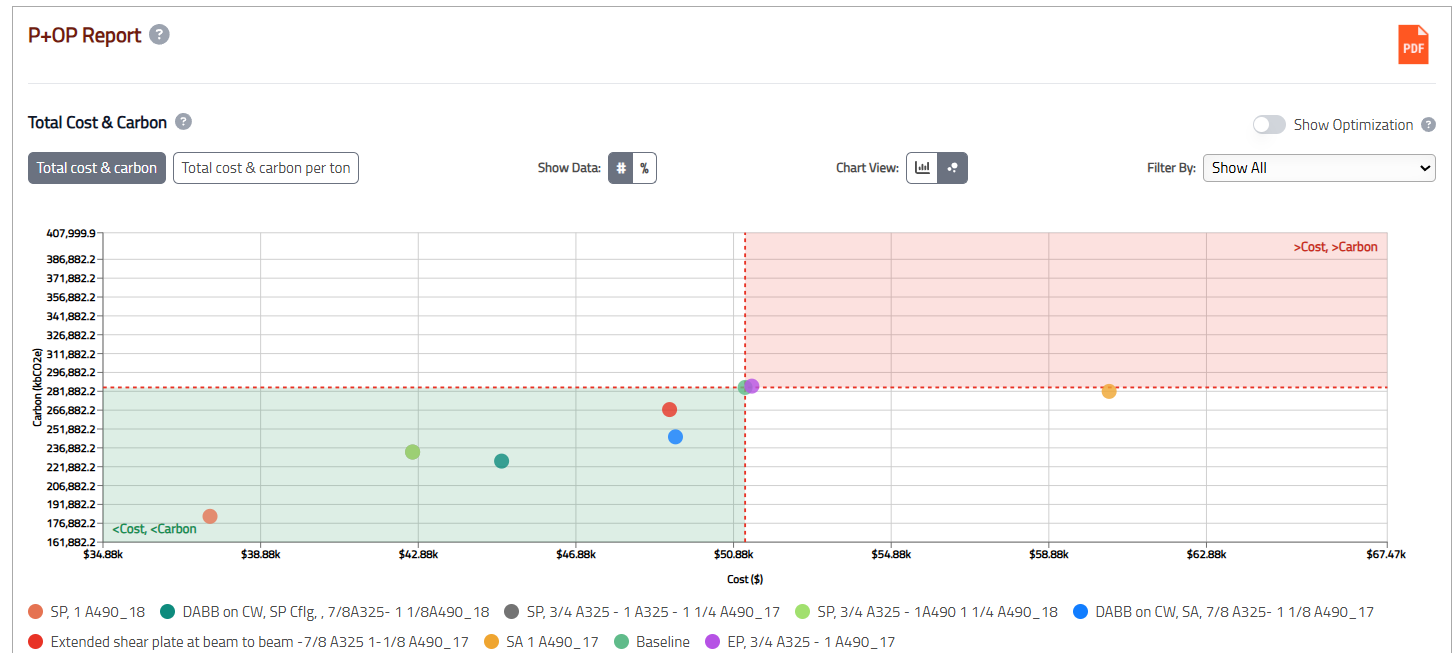
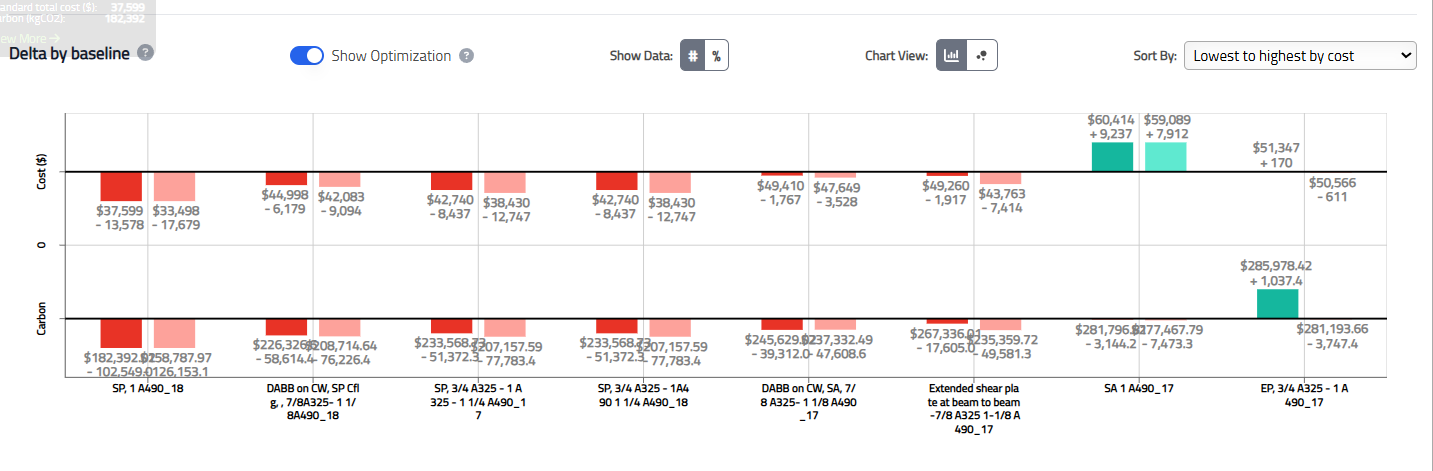
Figure: Cost-Carbon Analysis | 9 Design Simulations
The baseline run is customizable by the user and is based on the user's preferences inputs. The other 8 runs use baseline preferences and override the Connection Types and Bolt sizes and grades to study alternative connection strategies. These are hard coded by Qnect. The assumptions of these can be viewed per run.
One example of the 8 simulations is the extended shear plate. This connection type is growing in popularity due to its speed of erection while also improving safety. Other connection types include shop welded connections instead of shop bolted since some fabricators have that preference.
The user can also see the impact of optimizing the connections with fewer bolts by selecting the Show Optimization option. This reduction shows much less carbon and/or cost by reducing bolts in the shop and field. Note that for every bolt eliminated, there are two holes in the shop not drilled or punched.
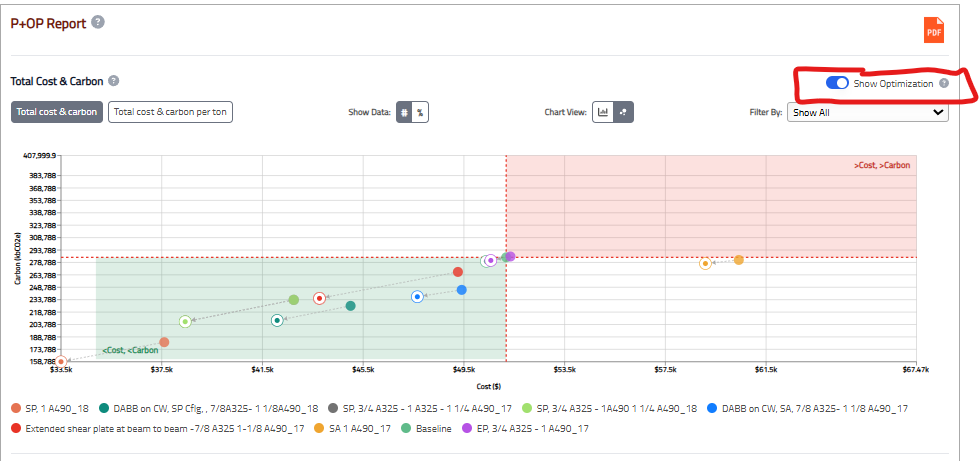
Figure: Cost-Carbon Analysis | Bolt Optimization
The user can further research what components of the material, fabrication or erection stages have the greatest impact on the embodied carbon. They toggle on/off the Optimization to see the impact of reduced bolting on the embodied carbon in the shop and field.
Figure 9: Cost-Carbon Analysis | Carbon by Component
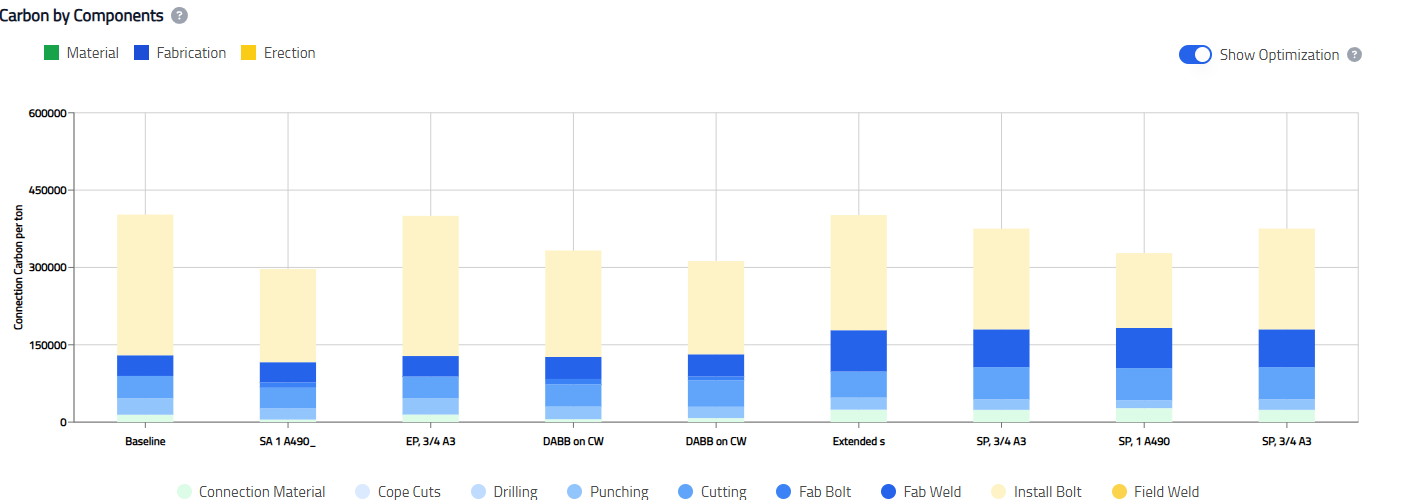
Figure: Cost-Carbon Analysis | Carbon by Component
Users can also open the Preference Optimization (PoP) report to see a web report version of the dashboard data to then export to pdf or Excel.

Viewing run specific data (BoP reports)
Users can verify the assumptions made for each of the 9 runs by opening a given run through the tooltips or clicking on a particular run. Here the users can see how connection types are used for the different framing conditions. Also the bolt sizes and grades are listed for this run. The user will see either 1, 2 or 3 bolt pairings.
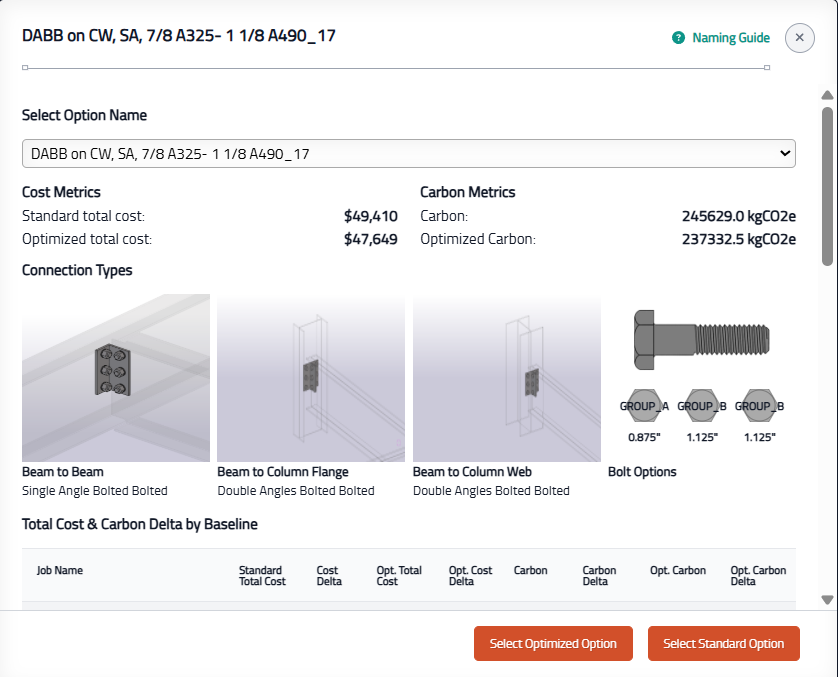
Figure: Cost-Carbon Analysis | Design Assumptions
Users explore the carbon and cost data for a particular run in the full carbon reports by opening the BoP analysis run. This report is valuable because it includes the steel quantities used to perform the calculations. It also includes the framing material quantities and embodied carbon tonnages. This data is useful for comparing full framing + connection impact on the steel design.
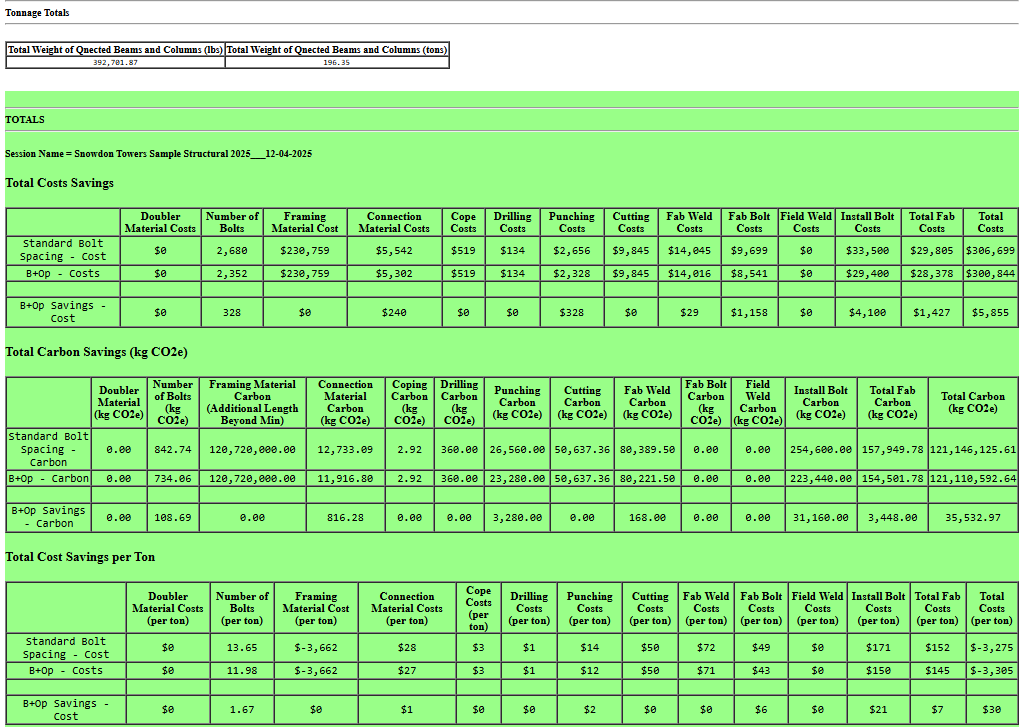
Figure: Cost-Carbon Analysis | Cost & Carbon Reports (BoP)